Next aptly version (0.4) would contain some changes to lower memory requirements while doing general operations: memory usage will be decreased by factor of 3. aptly is written in Go language, so this is a short story of optimizing Go program memory usage.
When I have been developing aptly, I suspected that memory usage would be not optimal, as aptly is processing huge amounts of package metadata (for example, when mirroring upstream Debian repositories consisting of 30000 packages). Memory usage went unnoticed until I was testing aptly in virtual machine with just 512 MB of memory, aptly was performing poorly because Linux was busy in swapping. This was something completely unexpected: so much memory? how could that be?
First I applied some general optimizations which were trivial:
- some long operations (like mirroring) were happening in single function and some big data structures weren't required full time during function execution. So assigning nil to them allowed Go's garbage collector to reclaim unused memory faster.
- reusing buffers for structure encoding (this is safe, as there're no concurrent operations and resulting byte slice is copied immediately).
Instead of creating buffer every time...
// Encode does msgpack encoding of Package
func (p *Package) Encode() []byte {
    var buf bytes.Buffer

    encoder := codec.NewEncoder(&buf, &codec.MsgpackHandle{})
    encoder.Encode(p)

    return buf.Bytes()
}
... re-use buffer:
// Internal buffer reused by all Package.Encode operations
var encodeBuf bytes.Buffer

// Encode does msgpack encoding of Package, []byte should be copied, as buffer would
// be used for the next call to Encode
func (p *Package) Encode() []byte {
    encodeBuf.Reset()

    encoder := codec.NewEncoder(&encodeBuf, &codec.MsgpackHandle{})
    encoder.Encode(p)

    return encodeBuf.Bytes()
}
Second, I had to find reliable way to measure memory consumption, that was easy thanks to CloudFlare blog post. What I discovered first was:
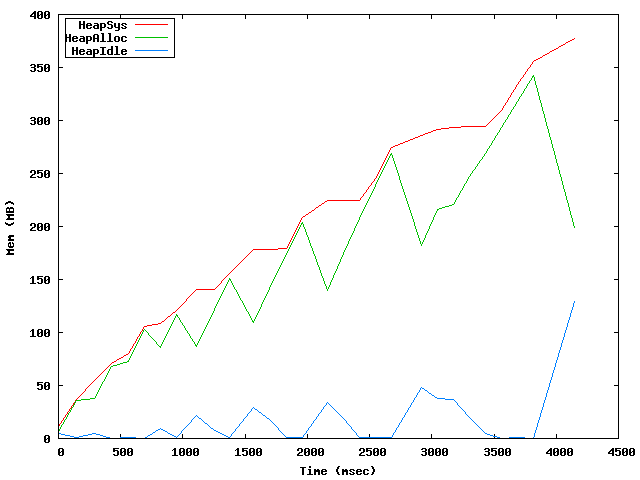
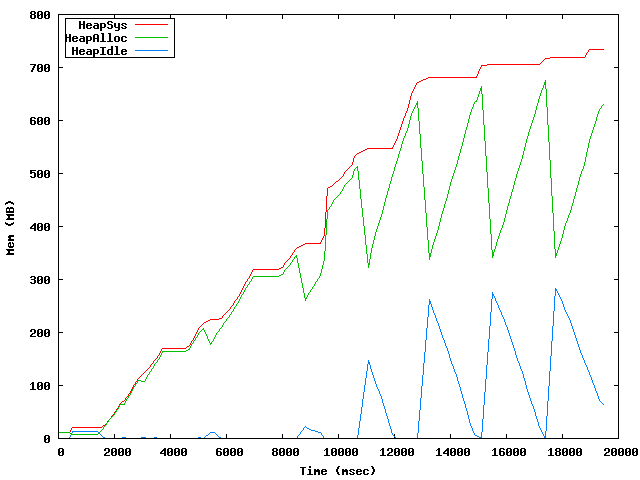
First graph is for aptly snapshot verify command verifying dependencies in whole Debian wheezy distribution, second graph is aptly mirror update command parsing package metadata and building empty download queue.
What I did next was CPU & memory profiling which showed two things:
- a lot of time spent in GC (unsurprisingly, for 800GB heap);
- there are no unexpected memory allocations, memory is allocated as expected.
The major memory usage was structure Package that represents parsed information from Debian control file. Some parts of that structure are required for all operations, some are required only when publishing or mirroring. So I had to split Package into parts that are loaded from DB on demand and removed when not used.
What I got in the end was:
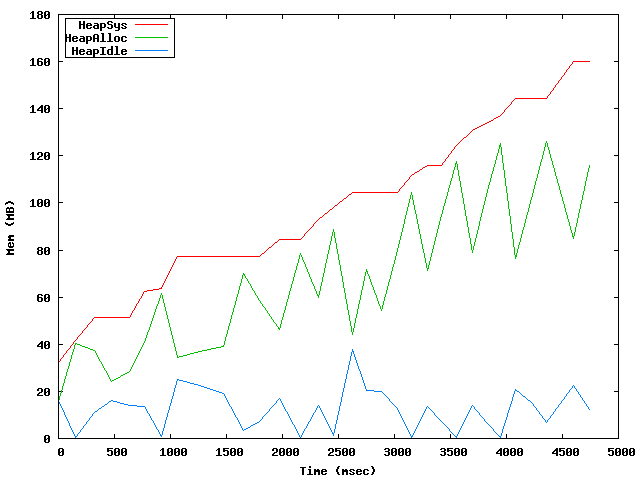
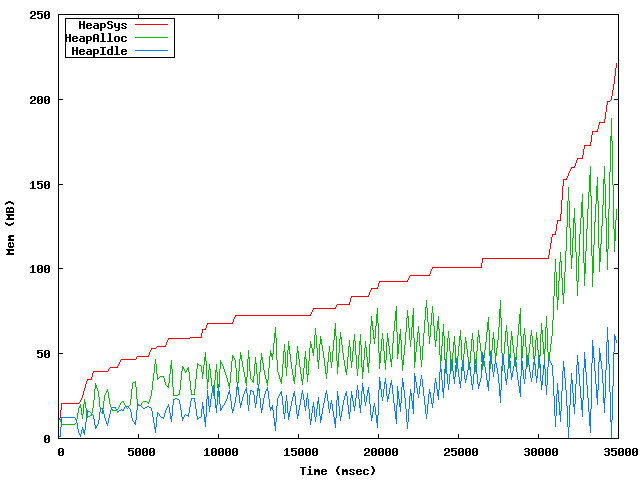
As it could be seen easily from these graphs, GC is freeing much more memory all the time keeping memory usage more linear. There are some more things that could be optimized to improve memory usage, but they are left for future aptly development.
In order to produce these graphs, aptly was extended with following code that dumps runtime.MemStats every 100ms:
memstats := cmd.Flag.Lookup("memstats").Value.String()
if memstats != "" {
    interval := cmd.Flag.Lookup("meminterval").Value.Get().(time.Duration)

    context.fileMemStats, err = os.Create(memstats)
    if err != nil {
        return err
    }

    context.fileMemStats.WriteString("# Time\tHeapSys\tHeapAlloc\tHeapIdle\tHeapReleased\n")

    go func() {
        var stats runtime.MemStats

        start := time.Now().UnixNano()

        for {
            runtime.ReadMemStats(&stats)
            if context.fileMemStats != nil {
                context.fileMemStats.WriteString(fmt.Sprintf("%d\t%d\t%d\t%d\t%d\n",
                    (time.Now().UnixNano()-start)/1000000, stats.HeapSys, stats.HeapAlloc, stats.HeapIdle, stats.HeapReleased))
                time.Sleep(interval)
            } else {
                break
            }
        }
    }()
}
Graphs were produced from raw data using gnuplot and following script:
set output 'mem.png'
set term png
set key box left
set xlabel "Time (msec)"
set ylabel "Mem (MB)"
plot "mem.dat" using 1:($2/1e6) title 'HeapSys' with lines, "mem.dat" using 1:($3/1e6) title 'HeapAlloc' with lines, "mem.dat" using 1:($4/1e6) title 'HeapIdle' with lines
Comments
Comments powered by Disqus